Reports & Analytics: your shop in numbers
What every KPI tile and chart on the Reports page measures, where each number comes from, and how to export it all as CSV.
Reports & data4 in this section
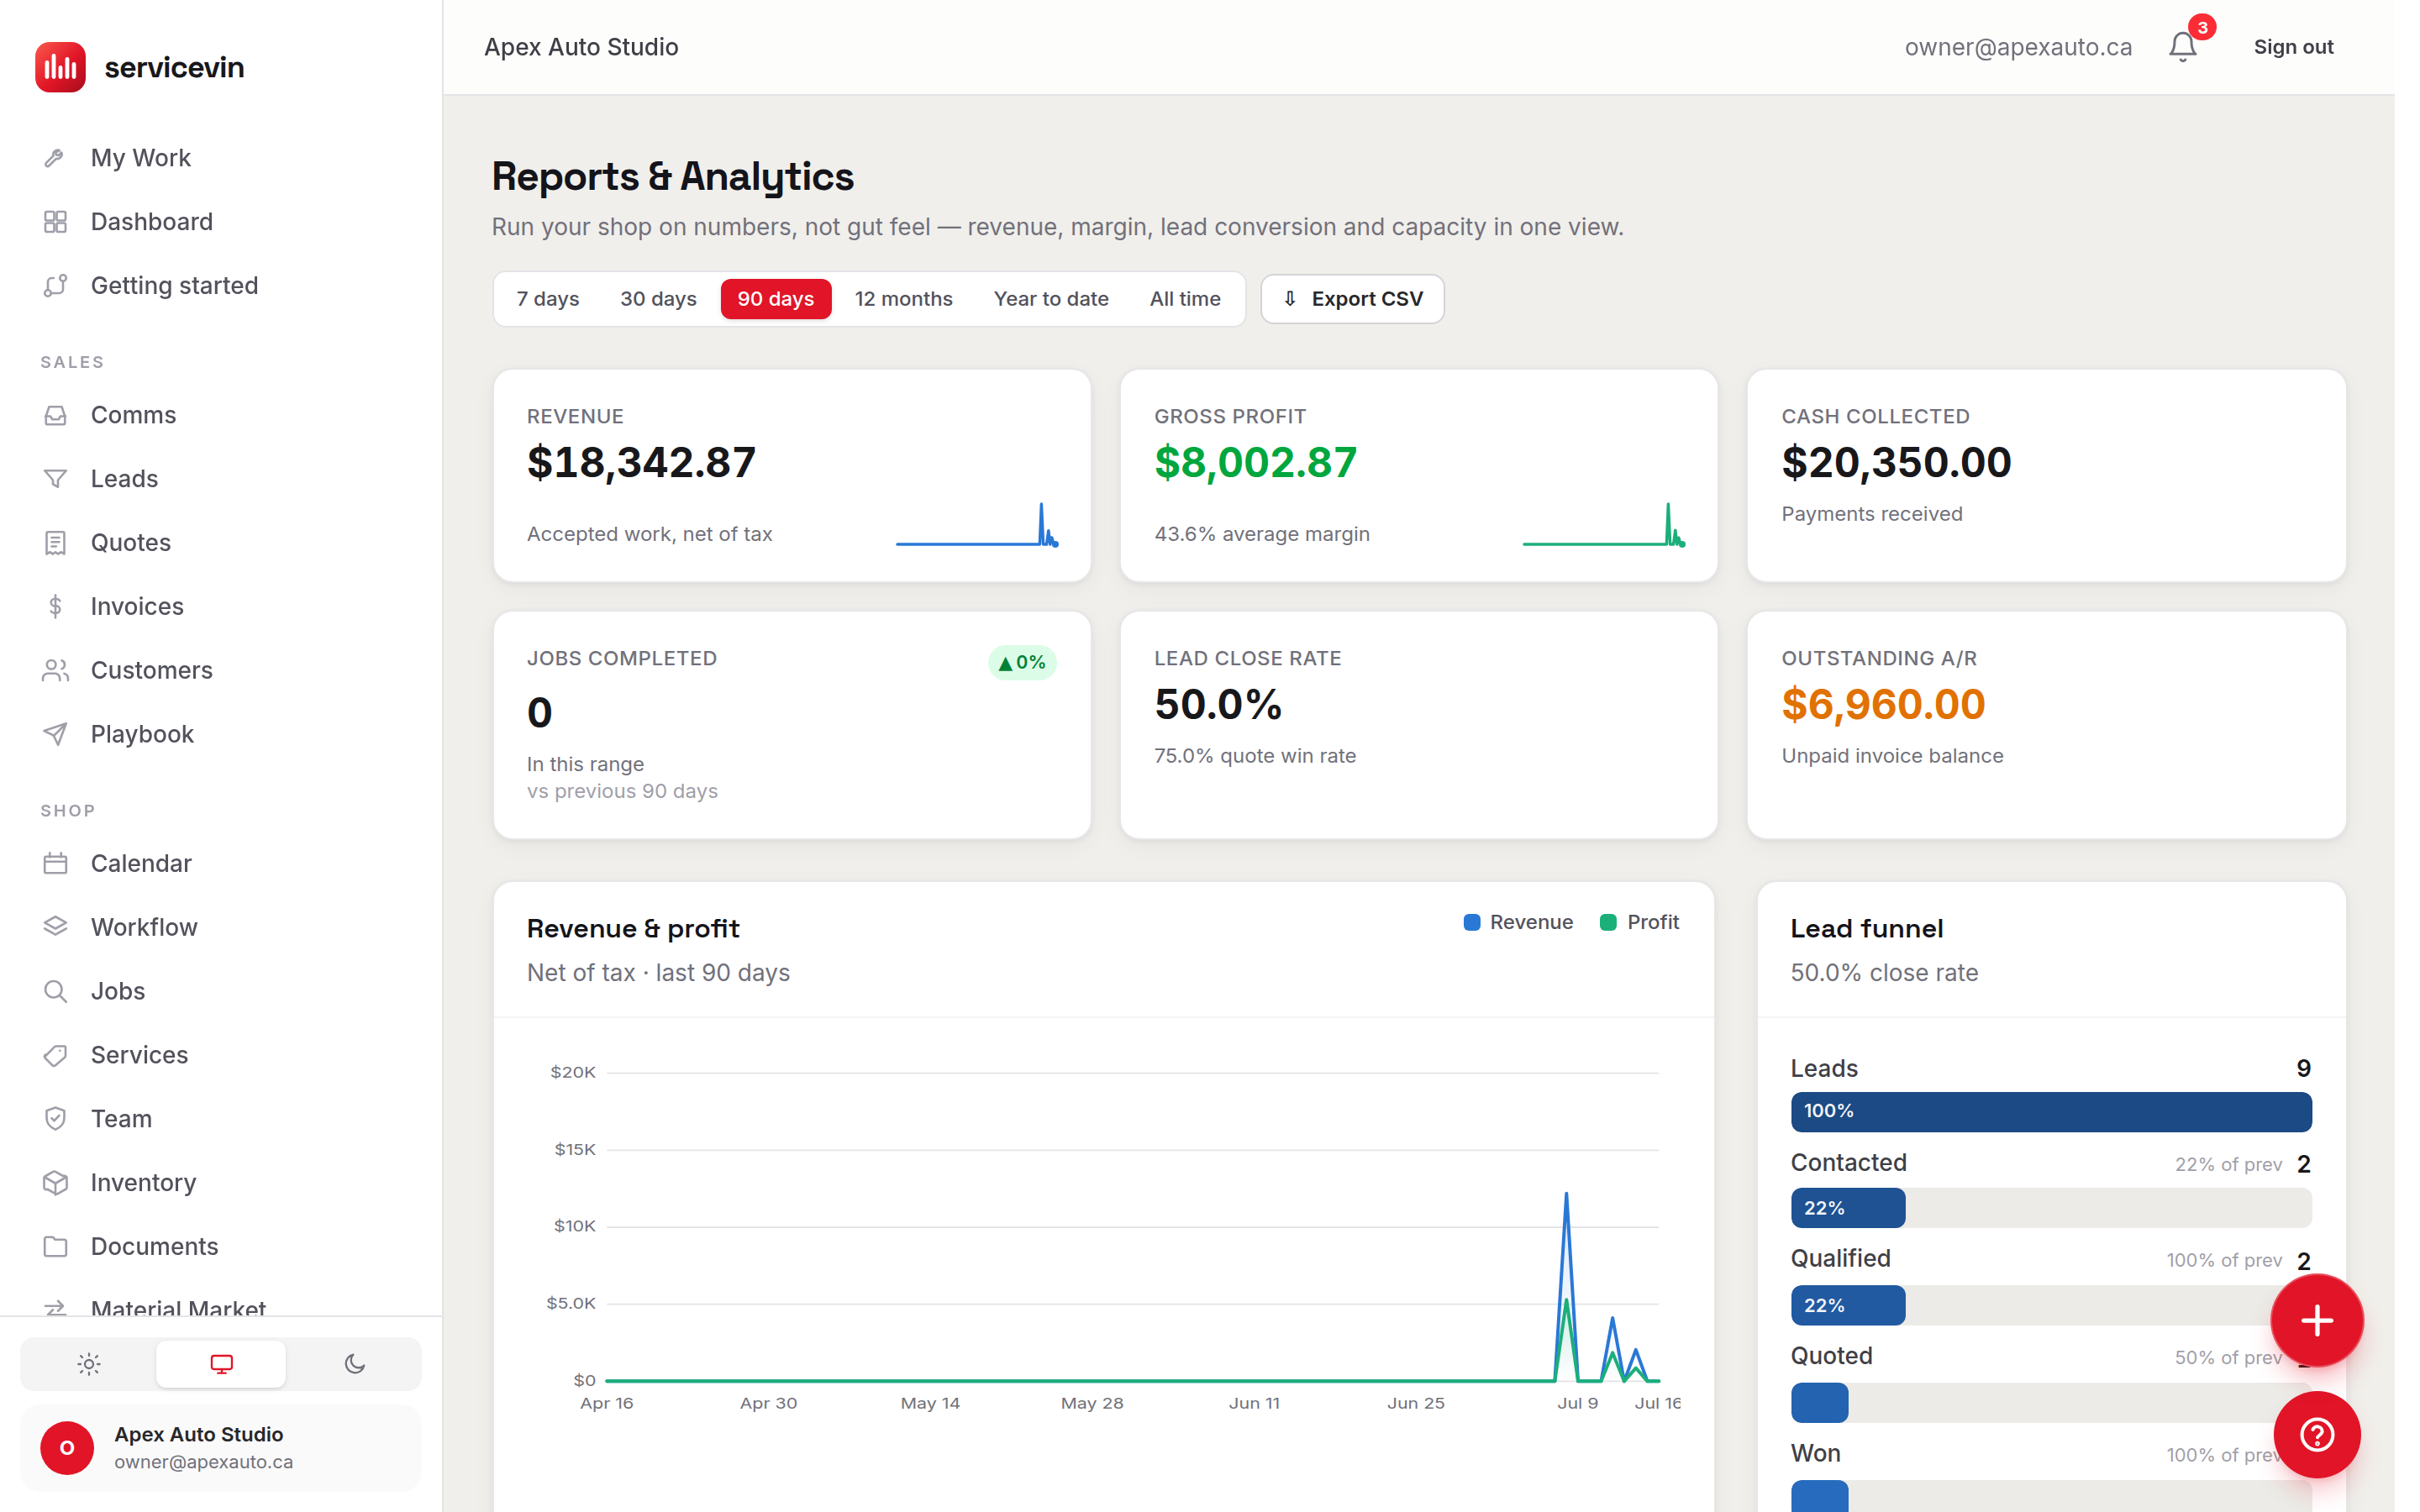
Reports & Analytics is the manager-only page where the whole shop rolls up: six KPI tiles (Revenue, Gross profit, Cash collected, Jobs completed, Lead close rate, Outstanding A/R) followed by the revenue & profit trend, lead and quote funnels, revenue by service and by installer, the production pipeline, invoice aging, film efficiency, top customers, and a quoted-vs-actual film cost table. The date-range picker in the header offers 7 days, 30 days, 90 days, 12 months, Year to date, and All time (default 90 days); each KPI shows a delta badge against the previous equal-length window, and the trend chart buckets by day for short ranges and by month for long ones. Ranges resolve in your shop's timezone from Settings.
What feeds each number
The Export CSV button in the header downloads the exact report you're looking at — the KPI block plus the by-service, trend, lead-source, top-customer, installer, and film-variance tables — as servicevin-report-<range>.csv, built entirely in your browser from the numbers already on screen. Switch the range first if you want a different window in the file.
The margin-truth table
Quoted vs actual film cost is the page's sharpest tool: for each completed job it compares the material cost you priced into the quote against what the job actually drew from your rolls. A positive variance (red) means the job ate more film than you charged for — biggest under-quoters sort to the top. If a service shows up here repeatedly, raise its material allowance in Services. You can also just Ask Dash — "which services are we under-quoting on film?" — from the ? button.
Troubleshooting
The page says "No activity to report yet" or charts show empty states.
Why: There are no accepted quotes, leads or jobs inside the selected range — a new shop, or a range that's too narrow.
Fix: Widen the range picker (try 12 months or All time). Revenue only appears once quotes are marked accepted.
Revenue shows but Gross profit looks wrong or margin is missing.
Why: Profit comes from the cost side of your quote lines — services quoted with no cost report 100% margin.
Fix: Set real material and labour costs on your services in /services so new quotes carry honest margins.
Installer chart lumps everything under an unassigned bucket.
Why: Jobs in the range have no assignee, so revenue can't be attributed to a person.
Fix: Assign jobs on the Workflow board or Calendar — revenue and booked hours follow the assignee.
Common questions
Why doesn't Revenue match my invoice totals or bank deposits?
Revenue is accepted quotes net of discounts and excluding tax — the value of work you won in the range. Invoices include tax, and deposits lag the work. For money in the door, use the Cash collected tile; for money still owed, Outstanding A/R.
Who can see the Reports page?
Managers and owners only — it lives in the manager side of the app, so techs never see shop financials.
Why is the film-variance table empty?
It needs completed jobs with film actually logged against rolls in the range. If installers aren't recording draws in Inventory, there's no actual cost to compare.